I’ve recently been reading Drawing Theories Apart: The Dispersion of Feynman Diagrams in Postwar Physics, by David Kaiser. Feynman diagrams combine my longstanding interest in physics with my current weird-interest-of-the-moment, text as a technology (this was also the background inspiration for my recent visual programming post). They aren’t exactly text, but they’re a formalised, repeatable type of diagram that follow a certain set of rules, so they’re definitely text-adjacent. I ended up getting more interested in the details of the physics than in the text-as-technology angle, so that’s going to be the main focus of this somewhat rambling review, but a few other topics will come up too.
Feynman diagrams turn out to be an interesting lens for looking at the history of physics. One obvious way to think of physics is as a set of theories, like ‘thermodynamics’, ‘electromagnetism’, ‘quantum mechanics’, and so on, each with a sort of axiomatic core that various consequences can be developed from. This fits certain parts of physics rather well – special relativity is a particularly good fit, for instance, with its neat conceptual core of a few simple postulates.
At the other end of the scale is something like fluid dynamics. In theory I suppose most people in fluid dynamics are looking at the consequences of one theory, the Navier-Stokes equations, but that’s a horribly complicated set of nonlinear equations that nobody can solve in general. So in reality fluid dynamics is splintered into a bunch of subdisciplines studying various regimes where different approximations can be made – I’m not an expert here but stuff like supersonic flow, boundary layers, high viscosity – and each one has its bag of techniques and set of canonical examples. Knowing about Navier-Stokes is pretty useless on its own, you’re also going to need the bag of techniques for your subfield to make any progress. So a history of fluid dynamics needs to largely be a history of these techniques.
Quantum field theory, where Feynman diagrams were first developed, is also heavy on bags of techniques. These are harder than postulates to transmit clearly through a textbook, you really have to see a lot of examples and work exercises and so on, so tacit knowledge transmitted by experts is especially important. Kaiser makes this point early on (my bolds):
Once we shift from a view of theoretical work as selecting between preformed theories, however, to theoretical work as the crafting and use of paper tools, tacit knowledge and craft skill need not seem so foreign. Thomas Kuhn raised a similar problem with his discussion of “exemplars”. Kuhn wrote that science students must work to master exemplars, or model problems, before they can tackle research problems on their own. The rules for solving such model problems and generalizing their application are almost never adequately conveyed via appeals to overarching general principles and rarely appear in sufficient form within published textbooks.
This focus on ‘paper tools’ is in the tradition of Bruno Latour’s work on ‘inscriptions’, and in fact the title of Kaiser’s book comes from Latour’s paper, Visualisation and Cognition: Drawing Things Together [pdf]. Latour talks about the way that complicated laboratory procedures need to be condensed down into marks on paper in order to communicate with other scientists:
Like these scholars, I was struck, in a study of a biology laboratory, by the way in which many aspects of laboratory practice could be ordered by looking not at the scientists’ brains (I was forbidden access!), at the cognitive structures (nothing special), nor at the paradigms (the same for thirty years), but at the transformation of rats and chemicals into paper… Instruments, for instance, were of various types, ages, and degrees of sophistication. Some were pieces of furniture, others filled large rooms, employed many technicians and took many weeks to run. But their end result, no matter the field, was always a small window through which one could read a very few signs from a rather poor repertoire (diagrams, blots, bands, columns). All these inscriptions, as I called them, were combinable, superimposable and could, with only a minimum of cleaning up, be integrated as figures in the text of the articles people were writing. Many of the intellectual feats I was asked to admire could be rephrased as soon as this activity of paper writing and inscription became the focus for analysis.
These inscriptions are transportable and recombinable by scientists in different locations (‘immutable mobiles’):
If you wish to go out of your way and come back heavily equipped so as to force others to go out of *their* ways, the main problem to solve is that of *mobilization*. You have to go and to come back *with* the “things” if your moves are not to be wasted. But the “things” have to be able to withstand the return trip without withering away. Further requirements: the “things” you gathered and displaced have to be presentable all at once to those you want to convince and who did not go there. In sum, you have to invent objects which have the properties of being *mobile* but also *immutable*, *presentable*, *readable* and *combinable* with one another.
Kaiser’s focus is instead on the ways that diagrams elude this easy transmissibility, and the background of tacit knowledge that they rely on: ‘drawing theories apart’ rather than ‘drawing things together’. Here’s a representative anecdote:
… in the summer of 1949, Enrico Fermi had complained that he was unable to make sense of one of Bethe’s own recent papers, and hence could not reproduce and extend Bethe’s calculations. Fermi and Bethe were both experts in the field in question, and they had worked closely together throughout the war years; they knew the territory and they knew each other quite well.
Also, of course, they were Fermi and Bethe! If they can’t do it, there isn’t much hope for the rest of us.
What Feynman diagrams are…
Before I go any further, it might be useful to give a rough indication of what Feynman diagrams are, and what it’s like to calculate with them. (Disclaimer before I attempt to do this: I only have a basic knowledge of this myself!) The idea is that they’re a notational device used to translate big ugly equations into something easier to manipulate. Unlike most popular science explanations, I’m going to risk putting some of these big ugly equations on the screen, but the details of them are not important. I just want to give an idea of how they’re translated into diagrams.
The examples I’m using come from some excellent notes on Solving Classical Field Equations, by Robert Helling. These notes make the point that Feynman diagrams can be used in many contexts, including in classical physics – they’re not a quantum-only thing. It makes more sense to think of them as applying to a particular kind of mathematical method, rather than to a type of physical theory as such. This method is a specific kind of perturbation theory, a general class of techniques where you make a rough (‘zeroth-order’) approximation to a calculation and then add on successive (‘first-order’, ‘second-order’, ‘third-order’…) correction terms. If all goes well, each correction term is smaller enough than the last that the whole thing converges, and you get a better and better approximation the more terms you include.
Now let’s see how the correction terms map to diagrams. Here’s the first order correction for Helling’s example, in standard equation form:
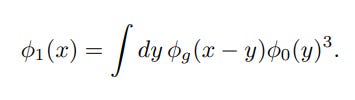
And here’s the corresponding diagram:
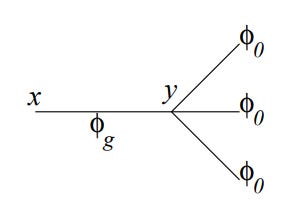
I’m not going to go into the details of the exact rules for translating from equation to diagram, but hopefully you can see some correspondences – the cubed term translates into three branches, for example. The full rules are in Helling’s paper.
At this point there isn’t a big difference between the equation and the diagram in terms of total effort to write down. But in perturbation theory, the higher the order you go to, the more hairy looking the correction terms get – they’re built up in a kind of recursive way from pieces of the lower-level correction terms, and this gets fiddly quickly. For example, here’s the third order correction term:
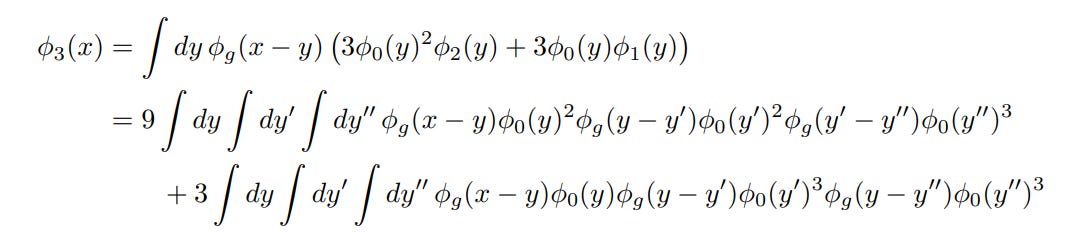
Ugh. At this point, you can probably see why you want to avoid having to write this thing down. In diagram form this term becomes:
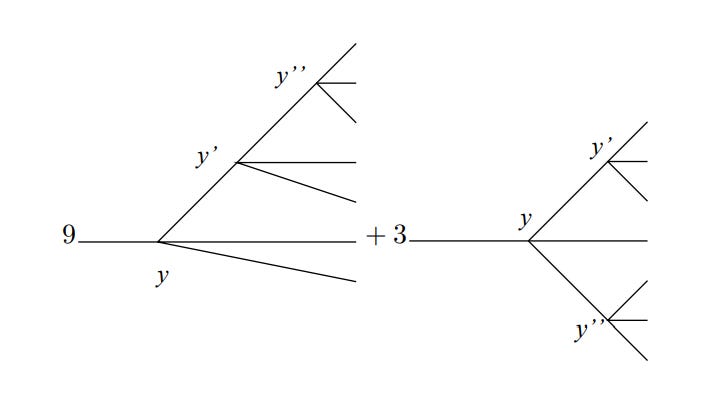
This is a lot less mistake-prone than writing down the big pile of integrals, and the rules tell you exactly what diagrams need to be included, what number to put in front of each one, etc. This is a big improvement. And that becomes even more important in quantum electrodynamics, where the calculations are much more complicated than these example ones.
… sort of
Well, that’s one view of what Feynman diagrams are, at least. As the subtitle indicates, this book is about the dispersion of Feynman diagrams through physics. A large part of this is about geographical dispersion, as physicists taught the new techniques to colleagues around the world, and another part is about the dispersion of the methods through different fields, but the most interesting parts for me were about the dispersion of the meaning of diagrams.
These differences in meaning were there from the start. In the section above I described Feynman diagrams as a notational device for making a certain kind of calculation easier. This mirrors the view of Freeman Dyson, who was the first person to understand Feynman’s diagrammatic method and show its equivalence to the existing mathematical version. Dyson was apparently always very careful to start with the standard mathematics, and then show how the diagrams could replicate this.
None of this fits with how Feynman himself viewed the diagrams. For Feynman, the diagrams were a continuation of an idiosyncratic path he’d been pursuing for some time already, where he tried to remove fields from his models of physics and replace them with direct particle interactions. He saw the diagrams themselves as describing actual particle interactions occurring in spacetime, and considered them to take precedence over the mathematical description:
… Feynman believed fervently that the diagrams were more primary and more important than any derivation that they might be given. In fact, Feynman continued to avoid the question of derivation in his articles, lecture courses and correspondence… Nowhere in Feynman’s 1949 article on the diagrams, for example, were the diagrams’ specific features or their strict one-to-one correlations with specific mathematical expressions derived or justified from first principles. Instead, Feynman avowed unapologetically that “Since the result was easier to understand than the derivation, it was thought best to publish the results first in this paper.”
This split persisted as methods were taught more widely and eventually condensed into textbooks. Some physicists stuck with the mathematical-formalism-first approach, while others took Feynman’s view to an extreme:
James Bjorken and Sidney Drell began their twin textbooks on relativistic quantum mechanics and quantum field theory from 1964 and 1965 with the strong statement that “one may go so far as to adopt the extreme view that the full set of all Feynman graphs is the theory.” Though they quickly backed off this stance, they firmly stated their “conviction” that the diagrams and rules for calculating directly from them “may well outlive the elaborate mathematical structure” of canonical quantum field theory, which, they further opined, might “in time come to be viewed more as a superstructure than as a foundation.”
I’d never thought about this before, but this line of argument makes a fair bit of sense to me. This was a new field and the mathematical formalism was not actually very much older than Feynman’s diagrams. So everything was still in flux, and if the diagrams looked simpler than the formalism then maybe that looked like an indication to start there instead? I’d be interested now to learn a bit more of the history.
A third motivation also appeared at this point. The immediate postwar years were a time of enormous expansion in physics funding, especially in the US, and huge numbers of new students were entering the field. These students mostly needed to calculate practical things quickly, and conceptual niceties were not important. Feynman diagrams were relatively straightforward to learn compared to the underlying formalism, so a diagram-first route that got students calculating quickly became popular.
This pragmatic motivation is one reason that Kaiser’s focus on diagrams works so well, compared to a theory-first approach. Most practitioners were not even trying to teach and apply consistent theories:
… textbooks during the 1950s and 1960s routinely threw together techniques of mixed conceptual heritage, encouraging students to apply an approximation based on nonrelativistic potential scattering here, a lowest-order Feynman diagram there.
There wasn’t any need to, when the pragmatic approach was working so well. New experimental results were coming out all the time, and theorists were running to keep up, finding ways of adapting their techniques to solve new problems. There was more than enough work to keep everyone busy without needing to worry about the conceptual foundations.
There’s something kind of melancholy about reading about this period now. This was the golden age of a particular type of physics, which worked astonishingly well right up until it didn’t. Eventually the new experimental results ran dry, theory caught up, and it was no longer obvious how to proceed further with current techniques. Other fields continued to flourish – astronomy, condensed matter – but particle physics lost its distinctive cultural position at the leading edge of knowledge, and hasn’t regained it.
Still, I enjoyed the book, and I’m hoping it might end up helping me make some more sense of the physics, as well as the history. Since reading Helling’s notes on Feynman diagrams in classical physics, I’ve been curious about how they connect to the quantum versions. There’s a big difference between the classical and quantum diagrams – the quantum ones have loops and the classical ones don’t – and I’d like to understand why this happens at a deeper level, but it’s kind of hard to compare them properly when the formalisms used are so different. Knowing more about the historical development of the theory has given me some clues for where to to start from. I’m looking forward to exploring this more.
